Luxury travel spans a trillion-dollar market, but the most useful figures explain who travels, where they go, and what they spend. This report brings those findings together with their dates, definitions, and original sources. Market estimates, traveler surveys, and hotel statistics are labeled separately, so each number can be cited in its proper context.
Luxury travel statistics at a glance
| Finding | What it measures | Source |
|---|---|---|
| $1.7 trillion | Estimated global luxury travel market, 2026 | Grand View Research |
| €251 billion | Estimated luxury hospitality market, 2025 | Bain / Altagamma |
| $150.22 billion | Estimated luxury hotel market, 2026 | Mordor Intelligence |
| No. 1: Italy | Overall destination in the 2026 advisor outlook | Virtuoso |
| 25.3 million | High-net-worth individuals worldwide, 2025 | Capgemini |
| 4.3 trips | Mean annual leisure trips, affluent US top-10% cohort | Resonance |
| 79% | Selected US luxury travelers planning higher spending in 2026 | Flywire |
| Nearly $14,000 | Median annual travel spending among travel purchasers, Q3 2026 panel | Altiant |
How large is the luxury travel market?
$1.7 trillion is Grand View Research’s estimate for the global luxury travel market in 2026.
Hotel-only and hospitality estimates cover different categories and should be quoted with their publisher’s definition.
| Value | Measure and period | Source |
|---|---|---|
| $1.6 trillion | Luxury travel market, 2025 estimate | Grand View Research |
| $1.7 trillion | Luxury travel market, 2026 estimate | Grand View Research |
| $3.0 trillion | Luxury travel market, 2033 forecast | Grand View Research |
| 8.5% | Forecast compound annual growth, 2026–2033 | Grand View Research |
| $150.22 billion | Luxury hotel market, 2026 estimate | Mordor Intelligence |
| €251 billion | Luxury hospitality market, 2025 estimate | Bain & Company / Altagamma |
| 3% growth | Luxury hospitality, 2025 versus 2024, current exchange rates | Bain & Company / Altagamma |
| €6 billion | Luxury cruise market, 2025 estimate | Bain & Company / Altagamma |
| 10% growth | Luxury cruises, 2025 versus 2024, current exchange rates | Bain & Company / Altagamma |
Grand View Research models luxury travel broadly; Mordor models luxury hotels; Bain estimates its own hospitality and cruise categories. Their boundaries, methods, currencies, and periods differ. Do not add them together or use one to calculate another’s market share. The growth forecast is the publisher’s figure, not a calculation from the rounded totals above.
Luxury travel destinations and travel seasons
Italy ranked first, Japan second, and Greece third in Virtuoso’s 2026 destination outlook. National evidence adds another dimension: high-spending visitors in Japan, five-star demand in Italy, and hotel capacity in Greece.
Which destinations rank highest for luxury travel?
| Rank | Destination |
|---|---|
| 1 | Italy |
| 2 | Japan |
| 3 | Greece |
| 4 | France |
| 5 | Croatia |
| 6 | Portugal |
| 7 | Spain |
| 8 | South Africa |
| 9 | Australia |
| 10 | Canada |
These positions reflect an advisor-network outlook, not arrival or spending shares.
The survey received 2,485 responses across more than 50 countries. Sources: Virtuoso rankings; survey details.
Which places lead for different trips?
| Category | First | Second | Third |
|---|---|---|---|
| Family travel | 1. Italy | 2. Japan | 3. Costa Rica |
| Honeymoons | 1. Italy | 2. Greece | 3. Bali |
| City destinations | 1. Paris | 2. Tokyo | 3. Barcelona |
| Cruise itineraries | 1. Mediterranean | 2. Alaska | 3. Greek Isles |
| Destinations on the rise | 1. Iceland | 2. Antarctica | 3. Norway |
Trip purpose changes the shortlist. The “on the rise” category measures advisor sentiment, not a published growth rate. Source: Virtuoso.
What do country-level figures show?
These indicators describe different markets and years. Each country keeps its own definition; the figures are not a comparable league table.
- 590,000 high-value inbound travelers visited Japan in 2023, according to JNTO estimates. Their spending totaled ¥1.0 trillion.
- 2.4% of inbound visitors accounted for 19.1% of inbound travel spending in Japan. This shows the segment’s economic weight relative to its size.
- 50.6% spending growth and 83.2% traveler growth were recorded for that Japanese segment between 2019 and 2023.
JNTO defines high-value trips as at least ¥1 million of in-destination spending per person. These are modeled estimates using card-payment data and other inputs, with extrapolation beyond directly studied markets. Source: JNTO, June 2025 release.
- 12.7% of US-resident guest nights in Italian accommodation were in five-star or five-star-luxury hotels in 2024. This measures accommodation choice within one origin market.
- 21.5% of five-star hotel nights in Italy came from US residents, compared with 10.5% from Germany and 6.7% from the United Kingdom. Here, the denominator is five-star demand itself.
Source: Istat, 2024 tourism results. Country of residence does not establish a traveler’s wealth.
- 869 five-star hotels provided 112,074 rooms in Greece in 2025. That was 24.9% of classified hotel rooms, a Calanova calculation. These figures measure supply, rather than visitors or spending.
Source: Hellenic Chamber of Hotels. Our Greece luxury travel statistics report examines that capacity by region and destination.
Do luxury travelers favor new places or familiar favorites?
- 72% of luxury travelers in McKinsey’s 2024 five-market study valued visiting a new destination, compared with 44% of its nonluxury comparison group. The luxury definition was average lodging expenditure of at least $500 a night. Source: McKinsey.
- 93% preferred returning to familiar destinations in Marriott’s separate 2025 affluent survey across seven Asia-Pacific markets. Different questions and populations mean this is not a contradiction of McKinsey’s finding. Source: Marriott International.
How are climate and crowds changing travel timing?
- 45% of Virtuoso advisors reported climate-related changes in client travel plans for the 2026 outlook.
- 76% of those advisors observed clients choosing shoulder-season or off-peak travel; 75% observed a preference for more moderate weather. Both percentages use the climate-change-observer subset. Source: Virtuoso.
- 40% of Europe trips fell in peak season in 2025 among Enchanting Travels’ US-based guests, down from 47% in 2023. The release does not disclose the seasonal boundaries or European subgroup size. Source: Enchanting Travels.
The advisor figures describe observations; the operator figures describe one business. For destination-specific timing, see our best time to visit Greece guide.
Who are luxury travelers, and who do they travel with?
Wealth, age, and travel-party surveys describe different groups of potential travelers. The figures below separate the size of the wealthy population from the habits reported by selected affluent samples.
How large is the wealthy population?
| Finding | Meaning |
|---|---|
| 25.3 million | High-net-worth individuals worldwide |
| Roughly 250,000 | Ultra-high-net-worth individuals, included within the total above |
| $98.3 trillion | Combined wealth of high-net-worth individuals |
Capgemini defines high net worth as at least $1 million in investable assets, excluding primary residences, collectibles, consumables, and consumer durables; ultra-high net worth starts at $30 million. These are wealth estimates, not counts of luxury travelers. Source: Capgemini Research Institute.
What do age and family data show?
- 80% of luxury leisure spending came from people under 60 in McKinsey’s 2024 research. This is a spending share, not the percentage of travelers in that age group. Source: McKinsey & Company.
- 36% of affluent Gen Z respondents paid the full cost of their leisure trips in Marriott’s 2026 eight-market Asia-Pacific study. The subgroup comprised 1,200 respondents ages 18–29; this does not describe all young travelers. Source: Marriott International.
- No. 1: family travel led Virtuoso’s 2026 travel-trend ranking; No. 2: multigenerational travel followed. These are advisor rankings, not traveler shares. Source: Virtuoso.
- 71% planned multigenerational trips in Preferred/Harris Poll’s 2025 affluent US survey. This records intentions, not completed family vacations. Source: Preferred Hotels & Resorts / The Harris Poll.
Which travel-party types are common?
| Share of respondents | Reported behavior |
|---|---|
| 65% | Took a couple’s holiday |
| 46% | Traveled with friends |
| 17% | Traveled solo |
| 27% | Extended a business trip for leisure |
Altiant surveyed 471 affluent and high-net-worth respondents across Europe, North America, and Asia-Pacific in July–September 2026.
Responses overlap; the business-extension figure uses all respondents, not only business travelers. Source: Altiant.
Share of respondents, previous year
Couple holidays65%
Holidays with friends46%
Solo holidays17%
0100%
Altiant Q3 2026 affluent panel. Categories overlap; these shares should not be added. Source: Altiant.
How much do luxury travelers spend, and how often do they travel?
Travel budgets depend on who was surveyed and how spending was measured. Annual trip counts and per-trip spending provide complementary views, with each study’s population kept alongside its figures.
US affluent travelers: spending and annual trip frequency
Resonance reports two US affluent cohorts, selected by income or net worth. The table compares their mean annual trip counts and mean spending per trip.
| Cohort | Mean annual leisure trips | Mean spending per trip |
|---|---|---|
| Top 10% by income or net worth | 4.3 | $7,900 |
| Top 1% by income or net worth | 6 | $12,400 |
The study surveyed 1,050 respondents in the top-10% cohort and 451 in the top-1% cohort. The public summary does not establish a per-person spending basis; the cohorts should not be added together. Source: Resonance / Leger.
How do other surveys measure travel frequency?
- Eight leisure trips, including three international trips, were planned on average for 2025 by Preferred/Harris Poll’s affluent US respondents. International trips are included in the total. Source: Preferred / The Harris Poll.
- 85% took at least three trips during the previous year in Flywire’s selected US luxury-traveler survey, fielded in October–November 2025. Source: Flywire.
- 2.1 international leisure trips were taken on average during the preceding year by Hurun’s Chinese high-net-worth respondents in its January 2026 report. Its sample comprised 470 respondents; this excludes their business trips. Source: Hurun Research Institute.
- 73% took multiple luxury holidays during the preceding year in Altiant’s Q3 2026 panel. Among respondents who purchased travel, annual spending had a median of nearly $14,000. The spending figure is a median among purchasers, not an average across the entire panel. Source: Altiant.
- Nine nights was the average typical long international leisure stay in Marriott’s 2026 affluent Asia-Pacific survey. “Long” trips lasted at least six nights; business trips were excluded. Source: Marriott International.
These surveys use different wealth thresholds, markets, and trip definitions. Planned trips are not completed trips, annual budgets are not per-trip spending, and a median is not a mean. The figures do not support a ranking of which country’s luxury travelers spend or travel most.
Are luxury travelers planning to spend more?
- 79% planned higher travel spending in 2026 than in 2025 in Flywire’s survey. This measures intentions rather than realized expenditure. Source: Flywire.
- 69% planned to increase long-trip spending in Marriott’s 2026 affluent Asia-Pacific study. Source: Marriott International.
- 47% were most willing to splurge on immediate-family trips in Marriott’s separate 2025 seven-market affluent survey. It is a preference measure, not the share of spending allocated to family travel. Source: Marriott International.
What makes a trip feel worth the price?
| Respondents | Frustration |
|---|---|
| 38% | Time wasted during travel |
| 37% | Average service |
| 36% | Accommodation falling below expectations |
These responses can overlap and are not percentages of trips that failed.
Marriott surveyed 2,800 affluent travelers across eight Asia-Pacific markets in April–May 2026. Source: Marriott International.
Share selecting each issue
Wasted time38%
Average service37%
Accommodation below expectations36%
0100%
Marriott 2026 affluent Asia-Pacific sample. Responses can overlap. Source: Marriott International.
- 60% would commit to a discounted, nonrefundable hotel rate in Flywire’s survey when offered a 20% discount. That discount was part of the question, not an observed saving. Source: Flywire.
- 34% cited unexpected fees or currency confusion as a payment frustration in the same survey. The combined response does not isolate the prevalence of either issue. Source: Flywire.
- Nearly 70% felt luxury hotels had lost character through standardization in Preferred/Harris Poll’s 2025 US survey. Source: Preferred Hotels & Resorts / The Harris Poll.
- Nearly two-thirds said a great previous stay encouraged a return booking in that survey. This is a stated motivation, not a measured rebooking rate. Source: Preferred Hotels & Resorts / The Harris Poll.
Flywire’s findings come from 520 US adults with household income of at least $150,000, average vacation spending of at least $10,000, a leisure trip in the prior year, and experience using a travel advisor. They describe a selected, high-spending group.
Luxury hotels: rates, occupancy, and supply
Room rates and occupancy describe operating performance; property and room counts describe supply. Company results and traveler preferences add context to these hotel-market measures.
What do luxury hotel operating figures show?
$309.40 per sold room-night was the average daily rate in Hyatt’s comparable luxury hotel portfolio in the second quarter of 2026. Its rate, occupancy, and revenue figures provide a company-level benchmark.
| Measure | Q2 2026 | Change from Q2 2025 |
|---|---|---|
| Average daily rate (ADR) | $309.40 | +5.9% |
| Occupancy | 72.3% | +0.5 percentage points |
| Revenue per available room (RevPAR) | $223.79 | +6.6% |
ADR measures room revenue per room sold; RevPAR spreads room revenue across all available rooms. The table uses Hyatt’s comparable hotels classified as luxury by STR, excludes all-inclusive properties, and reports changes in constant dollars. Source: Hyatt Q2 2026 results.
- 1.2% decline in net package RevPAR was reported for Hyatt’s separate comparable all-inclusive portfolio in Q2 2026. This measure includes package revenue, uses reported dollars, and spans brands beyond luxury. It is not directly comparable with room-only RevPAR above. Source: Hyatt.
Are independent hotels or chains driving luxury supply?
70% of luxury hotel properties were independent in McKinsey’s supply analysis published in May 2024, while 78% of planned luxury hotels were chain or franchise properties. These are property shares, not room shares; the underlying stock and pipeline snapshot dates were not separately stated. Source: McKinsey.
14% of IHG’s operating rooms belonged to its combined luxury and lifestyle category at June 30, 2026, compared with 21% of pipeline rooms. The category includes lifestyle brands, and pipeline rooms were not yet operating. Source: IHG half-year results.
Share of rooms in each separate base
Operating system rooms14%
Pipeline rooms21%
0100%
IHG at June 30, 2026. Luxury and lifestyle are combined; pipeline rooms are not operating rooms. Source: IHG Hotels & Resorts.
What accommodation styles appeal to affluent travelers?
- 77% considered the hotel brand important among luxury travelers in McKinsey’s 2024 survey across China, Germany, the UAE, the UK, and the US. Its luxury subgroup spent at least $500 a night on lodging on average. Source: McKinsey.
- 51% expressed interest in boutique hotels or resorts in Marriott’s 2026 survey of 2,800 affluent travelers across eight Asia-Pacific markets. This measures appeal within that sample, rather than bookings or global market share. Source: Marriott.
Private villas, residences, and vacation clubs
Private-accommodation surveys capture both interest and previous stays. Company figures show the scale of individual residence platforms and vacation clubs.
How strong is interest in private accommodation?
46% expressed interest in private villas or residences in Marriott’s 2026 affluent Asia-Pacific survey. Respondents could favor more than one accommodation type, so this should not be added to the boutique-hotel percentage. Source: Marriott.
30% had rented a beachfront villa during the preceding year in Altiant’s Q3 2026 survey of 471 affluent and high-net-worth respondents across Europe, North America, and Asia-Pacific. This records self-reported use, not future interest. Source: Altiant.

How large are individual residence and club businesses?
More than 25,000 travelers annually were served by the Exclusive Collective, according to onefinestay’s April 2026 company release. The platform spanned Exclusive Resorts, Inspirato, and onefinestay, with more than 3,000 leased and professionally managed residences worldwide. These are group figures, not onefinestay-only totals. Source: onefinestay release via Hospitality Net.
More than 11,000 active memberships were reported by Inspirato at June 30, 2025. This is a historical company figure for a club offering homes, hotels, and experiences; memberships are not unique travelers. It should not be added to the later Collective traveler count. Source: Inspirato Q2 2025 results.
Premium flights: passenger numbers, revenue, and availability
Passenger traffic, airline revenue, and cabin availability show different aspects of premium flying. The figures below keep those measures separate and cover both business and leisure travel.
How many international passengers fly business or first class?
| Finding | What it measures |
|---|---|
| 109.7 million | International business- and first-class passengers |
| 4.5% growth | Increase from 2024 |
| 5.5% | Share of all international passengers |
IATA’s premium category here includes business and first class, not premium economy.
The figures cover all trip purposes and are not a count of unique luxury vacationers. Source: IATA, 2025 World Air Transport Statistics.
How much revenue do premium airline products generate?
| Reporting period | Revenue | Year-over-year change |
|---|---|---|
| Full year 2024 | $20.599 billion | Comparison baseline |
| Full year 2025 | $22.097 billion | +7% |
| July–September 2026 | $6.818 billion | +18% |
| January–September 2026 | $19.100 billion | +16% |
Delta’s premium-product category is broader than business and first class. Figures exclude the separate loyalty-award and travel-service revenue lines.
Quarterly revenue is included in the nine-month total; these periods must not be added. Growth rates are the company’s rounded figures. Sources: Delta full-year 2025 results; Delta September-quarter 2026 results.
Two complete years, USD billions
2024$20.599bn
2025$22.097bn
025
Company-defined premium products, all travel purposes. Quarterly and nine-month results remain in the table. Source: Delta Air Lines.
- 16% premium revenue growth was reported by United for Q2 2026 versus Q2 2025. This is a company-defined revenue measure covering both business and leisure travel, not growth in passenger numbers. Source: United Q2 2026 results.
How widely available are premium cabins and lounges?
137 aircraft offered premium economy at Emirates as of September 14, 2026, with the cabin available on services to 90 destinations. Availability can vary by flight and date; these are fleet and network counts, not passengers carried. Source: Emirates.
50% had used a VIP airport lounge while on holiday during the previous year in Altiant’s Q3 2026 affluent panel. This measures participation, not lounge visits or paid-access purchases. Source: Altiant.
Private aviation: aircraft supply and flight activity
Aircraft deliveries measure new supply, while tracked departures measure flying activity. The figures below also distinguish fractional operators, corporate departments, and private ground transport.
How many new business jets are delivered?
854 business jets were delivered in 2025 in GAMA’s February 2026 shipment report. Source: GAMA 2025 shipment report.
383 business jets were delivered in the first half of 2026, 8.2% more than in the first half of 2025. These are newly delivered aircraft, not flights or charter bookings. Source: GAMA H1 2026 results.
Is business-jet flying increasing?
| Finding | Period and scope |
|---|---|
| 3.4% growth | Departures, January 1–October 4, 2026 versus the same period in 2025 |
| More than 79,600 departures | Week of September 28–October 4, 2026 |
| 9.9% growth | Fractional-operator activity, 2026 year to date through October 4 |
| 9.6% decline | Corporate flight-department activity, the same year-to-date period |
WINGX tracks business jets, including VIP airliners, but excludes turboprops from these figures.
Coverage spans all travel purposes, and operator classifications do not identify leisure trips. The weekly figure is a snapshot, not an annual total. Source: WINGX week 40 bulletin.
Year-over-year change
Fractional operators+9.9%
Corporate flight departments−9.6%
−10%0+10%
WINGX, January 1–October 4, 2026. Operator type does not identify leisure travel. Source: WINGX / JETNET.
- More than 65% fleet growth since 2019 was reported for fractional ownership fleets in Honeywell’s 2025 business-aviation outlook. It describes the size of that fleet segment, not the growth rate of all private aviation. Source: Honeywell.
What about private ground transfers?
- 26% used a private chauffeur on holiday during the preceding year in Altiant’s Q3 2026 affluent panel. This is a separate ground-transport measure and does not establish how many respondents flew privately. Source: Altiant.
Luxury cruises, expeditions, and river travel
Luxury, expedition, and river cruising are overlapping categories with different measures. Fleet counts describe supply, passenger figures describe traffic, and company results describe individual operators.
How large is the luxury cruise fleet?
| Year | Ships | Source |
|---|---|---|
| 2010 | 28 | CLIA 2025 report |
| 2024 | 97 | CLIA 2025 report |
| 2025 | 98 | CLIA May 2026 update |
The figures follow CLIA’s luxury classification.
The historical ship counts are shown separately from the wider ocean-cruise market below.
Ships in CLIA’s luxury category
201028 ships
202497 ships
202598 ships
0100
Separate dated observations. Year labels are categorical; gaps do not imply equal time intervals. Source: CLIA; CLIA.
- 1.7 million luxury cruise passengers were forecast for 2029 in CLIA’s May 2026 update. This is a forecast, not a completed-year passenger count. Source: CLIA.
- 37.2 million ocean-cruise passengers were reported worldwide in 2025 across all cruise categories. This provides broader industry context and must not be labeled luxury traffic. Source: CLIA 2026 industry report.
How fast is expedition cruising growing?
22% passenger growth was recorded for expedition and exploration cruises from 2023 to 2024 in CLIA’s 2025 report. Source: CLIA.
150% capacity growth was projected across 2019–2029 for expedition and exploration cruising in the same report. The period combines historical expansion with future deliveries; it is not a completed annual growth rate. Source: CLIA.
Expedition describes the type of voyage. It is not interchangeable with the luxury category, and the categories can overlap.
What do river-cruise operating figures show?
| Finding | What it measures |
|---|---|
| 168,604 passengers | Passengers carried by Viking River |
| 94.8% occupancy | Passenger cruise days divided by capacity passenger cruise days |
| $660 net yield | Adjusted gross margin per passenger cruise day |
Net yield is a company financial measure, not the ticket price paid by a traveler; occupancy is not the percentage of cabins occupied. These figures describe Viking River rather than the entire luxury river-cruise market. Source: Viking H1 2026 operating data.
- 53% of 2027 capacity had been sold by August 9, 2026, across Viking’s core products, including River, Ocean, Expedition, and Mississippi. This measures forward bookings in passenger cruise days, not realized 2027 occupancy or river-only sales. Source: Viking.
Yachts: construction, charter supply, and bookings
Construction orderbooks, charter fleets, and charter bookings measure different parts of the yacht market. The figures below keep project sizes, reporting periods, and company coverage explicit.
How many superyachts are on order?
| Measure | September 1, 2024 snapshot | September 1, 2025 snapshot | Change |
|---|---|---|---|
| Projects at least 24 meters | 1,138 | 1,093 | 3.95% decline |
| Projects in the 250-foot-plus band | 61 | 67 | 9.8% increase |
The snapshots appear in the 2025 and 2026 editions respectively. The larger-project band is labeled 76 meters plus in the source table.
Calanova calculated its growth as (67 ÷ 61 − 1) × 100, rounded to one decimal. These are projects under construction or on order, not yacht deliveries or charter bookings. Source: BOAT International 2026 Global Order Book.
Two dated snapshots; each panel has its own scale
All projects at least 24 meters
September 1, 20241,138
September 1, 20251,093
01200
Projects of 250 feet and above
September 1, 202461
September 1, 202567
080
BOAT International. Construction and orders, not charter bookings. The larger band is labeled 76m+ / 250ft+ in the source. Source: BOAT International.
What do charter bookings show?
These figures describe Burgess-reported business, not an independently measured global charter market.
The release does not provide an adjustment for changes in fleet or client coverage. Source: Burgess.
| Finding | What it measures |
|---|---|
| 5,970 charter days | Total days booked |
| 35% growth | Year-over-year increase in charter days, rounded by the publisher |
| 8.2 days | Mean charter duration |
| 58% | Share of bookings from returning clients |
- Two-thirds of 2026 charters booked by July 24 were in the West Mediterranean, according to Burgess. This was a booking snapshot, not the distribution of completed full-year trips. Source: Burgess.
How large is the yacht charter market?
- More than 2,300 yachts over 20 meters were available for charter worldwide in IYC’s first-half 2026 market review. Source: IYC.
- Approximately $2.2 billion in charter revenue was estimated for 2025 in that review. This is a broker’s estimate; the public summary does not disclose a full market-coverage or collection methodology. Source: IYC.
IYC’s charter fleet uses a different size threshold from BOAT’s construction orderbook. Revenue from renting yachts cannot be treated as revenue from yacht sales, and neither measures the number of individual luxury travelers.
How luxury travelers book: timing, advisors, and loyalty
Booking lead times, booking channels, and loyalty preferences show how surveyed travelers arrange their trips. Each result retains the market and traveler group covered by its source.
How far ahead do luxury travelers book?
These are survey responses, not a global booking database. The Marriott result refers specifically to longer leisure trips, while Flywire uses its own screened US traveler population.
| Finding | Booking behavior | Source |
|---|---|---|
| 61% | Book one to three months before departure; selected US luxury travelers surveyed in late 2025 | Flywire |
| 11% | Book at least six months ahead; the same US sample | Flywire |
| 52% | Book long leisure trips within two months of departure; Marriott’s 2026 eight-market Asia-Pacific sample | Marriott |
Do travelers book direct or use an advisor?
- 68% booked through supplier websites and 41% used travel agents in Resonance’s top-1% US cohort, surveyed in 2025 for its 2026 report. Respondents could use multiple channels; the shares are not mutually exclusive. Source: Resonance.
- 97% considered advisors the best route to personalized travel in Flywire’s survey. All respondents had already used a travel advisor, so this cannot measure advisor adoption among luxury travelers generally. Source: Flywire.
- 84% valued a trusted advisor above unlimited internet research in Preferred/Harris Poll’s 2025 affluent US survey. This is an attitude measure, not the percentage of bookings made through an advisor. Source: Preferred / The Harris Poll.
- 25% of IYC charters originated through IYC.com in its first-half 2026 review. Website origin does not establish that the entire transaction was completed through automated checkout. Source: IYC.
How important are hotel loyalty programs?
- 68% considered loyalty programs important among McKinsey’s luxury subgroup in its 2024 five-market survey. Source: McKinsey.
- 82% considered loyalty programs very important for ensuring hotel quality in Preferred/Harris Poll’s 2025 affluent US survey. The question and sample differ from McKinsey’s, so the two percentages are not a time trend. Source: Preferred / The Harris Poll.
AI and digital tools in luxury travel
| Share | Reported use |
|---|---|
| 19% | AI for travel inspiration and information, regional sample |
| 23% | AI for travel inspiration and information, Gen Z subgroup |
| 56% | Digital tools throughout the trip, overall sample |
These findings measure technology use, not bookings completed by AI. Source: Marriott.
The Gen Z subgroup is included in the regional sample. Its percentage should not be added to the overall share.
Share of survey respondents
Regional affluent sample19%
Gen Z subgroup23%
0100%
Marriott 2026, eight Asia-Pacific markets. Gen Z is included within the regional sample. This is not AI booking share. Source: Marriott International.
- 64% preferred local advice to AI concierge services and digital guides when navigating a destination in Preferred/Harris Poll’s 2025 affluent US survey. Advice preferences and AI inspiration are different questions; these results can coexist. Source: Preferred / The Harris Poll.
Wellness travel: market size, retreat use, and traveler interests
Wellness tourism spans all price levels. Global market estimates sit alongside affluent-traveler surveys here, so readers can distinguish overall spending from interest in retreats and particular experiences.
How large is wellness tourism?
| Finding | Measure and period |
|---|---|
| $893.9 billion | Worldwide wellness tourism spending, 2024 estimate |
| 13.8% growth | 2024 spending increase versus 2023, using the same report edition |
| $1,383.3 billion | Forecast annual wellness tourism spending in 2029 |
| 87% | Domestic share of wellness trips in 2024 |
| 83% | Secondary wellness share of wellness trips in 2024 |
| 38% higher spending | Average spending per international wellness trip versus the average international tourist, 2024 |
Secondary wellness travel adds wellbeing activities to a trip whose main purpose is something else. Domestic and secondary trips are overlapping classifications. GWI’s estimates cover wellness tourism at every price level; they cannot be added to luxury travel estimates. Source: Global Wellness Economy Monitor 2025.
How many affluent travelers choose wellness trips?
- 90% said wellness influenced booking decisions in Marriott’s 2025 affluent survey across seven Asia-Pacific markets. Influence does not mean wellness was the trip’s primary purpose. Source: Marriott.
- 34% planned a trip primarily for health and wellness over the next year in Resonance’s top-1% US cohort, surveyed in 2025. These were intentions at the time of the survey. Source: Resonance.
- 32% had visited a wellness retreat during the preceding year in Altiant’s Q3 2026 affluent panel, while 40% expected to visit one in the following year. The first figure records reported participation; the second records intention. Source: Altiant.
- 44% were interested in nature-based retreats in Flywire’s selected US luxury-traveler sample, surveyed in October–November 2025 for its 2026 report. This is interest, not a confirmed booking. Source: Flywire.
Which wellness experiences attract interest?
| Share of the interested subgroup | Experience |
|---|---|
| 31% | Mindfulness and digital detox |
| 39% | Health evaluations, including diet, sleep, posture, or gait assessments |
The base was 389 wellness-interested respondents within a 450-person affluent panel across China, Japan, Singapore, and Hong Kong. China was surveyed in October 2024; the other markets in March 2025. These percentages do not describe all luxury travelers. Source: Buzz vs Reality: APAC 2025.
Longevity, restoration, and privacy also appear as themes in Virtuoso’s 2026 advisor outlook. The report supports their editorial relevance, but does not establish a separate longevity-tourism market size, private-retreat booking volume, or medical benefit. Source: Virtuoso.

Food, safaris, sports, and local experiences
- 88% considered gastronomy important or very important in Marriott’s 2026 affluent Asia-Pacific survey. Source: Marriott.
- 87% valued local community engagement when choosing destinations among Marriott’s affluent Gen Z subgroup in 2026. Source: Marriott.
- 30% planned safari holidays in Marriott’s 2025 affluent seven-market Asia-Pacific study. This describes plans, not completed safari trips. Source: Marriott.
- 30% attended a sporting event while on holiday during the preceding year in Altiant’s Q3 2026 panel. Attendance does not prove the event was the reason for traveling. Source: Altiant.
- 3.8% selected shopping as a favorite travel theme in Hurun’s 2026 Chinese high-net-worth survey. This is a preference share, not the percentage of their travel budgets spent shopping. Source: Hurun.
Luxury rail and slower travel
Individual train capacities show the scale of specific luxury-rail products. Traveler surveys and transaction research offer a separate view of demand for slower and scenic journeys.
How large are individual luxury trains?
| Train | Cabins | Source |
|---|---|---|
| Britannic Explorer, United Kingdom | 18 | Belmond |
| La Dolce Vita Orient Express, Italy | 31 | Accor / Orient Express |
These figures describe two individual trains. They establish product capacity, not worldwide luxury rail demand.
79% expressed greater interest in slower, more relaxing holidays in the ILTM / Altiant / Hyatt four-market affluent panel. The question measures a preference for pace; it does not measure train bookings or an increase in nights away. Source: Buzz vs Reality: APAC 2025.

Growing interest in scenic and luxury rail was identified in Mastercard Economics Institute’s 2026 report using 2025 transaction data. Its grouping combines scenic and luxury services, and the reported train-share denominator is insufficiently clear for a luxury-only market-share claim. We therefore retain the directional finding without assigning it a global passenger or revenue share. Source: Mastercard Economics Institute.
Environmental impact and sustainability preferences
Flight records provide a basis for emissions estimates, while traveler surveys describe stated preferences. These measures answer different questions about the environmental impact of travel.
What is private aviation’s measured carbon footprint?
| Finding | Scope |
|---|---|
| At least 15.6 million metric tons of CO2 | Estimated direct emissions in 2023 |
| 46% increase | Direct emissions growth from 2019 to 2023 |
| 47.4% | Share of tracked flights shorter than 500 kilometers in 2023 |
The analysis covered 25,993 private aircraft, using flight records and aircraft fuel-consumption models. This is study coverage, not an independent census of the entire global fleet. The emissions estimate excludes non-CO2 climate effects, and the flights include business as well as leisure. Source: Gössling, Humpe, and Leitão, Communications Earth & Environment.
Do affluent travelers consider sustainability when booking?
- 52% always or sometimes prioritized sustainability when booking a holiday among US affluent respondents in Altiant’s July 2022 fieldwork, published in February 2023. This historical self-report does not measure verified purchases or emissions reductions. Source: Altiant.
The travel-season findings show how some advisors and operators describe changing trip timing. Choosing a different season does not, by itself, demonstrate a smaller environmental footprint.
Luxury travel outlook: forecasts and constraints
The outlook combines published forecasts with concerns reported in traveler and advisor surveys. Forecast capacity and deliveries remain distinct from realized trips, spending, and bookings.
What growth is forecast?
| Forecast | Period and coverage | Source |
|---|---|---|
| 38.3 million passengers | 2026, all ocean cruising | CLIA 2026 report |
| 42.1 million passengers | 2029, all ocean cruising | CLIA 2026 report |
| 8,500 new business jets | Deliveries over the decade forecast from October 2025 | Honeywell |
The cruise forecasts include all market segments. Honeywell’s aircraft projection is a forecast of deliveries, not firm orders, flights, or private leisure passengers.
- 45% of advisors had seen more ultraluxe requests in Virtuoso’s 2026 outlook. “Ultraluxe” was an advisor-reported category; this does not quantify private-island or resort-buyout demand separately. Source: Virtuoso.
What could constrain travel demand?
- 67% cited safety as a destination-choice factor in Resonance’s top-1% US cohort, surveyed in 2025. Source: Resonance.
- 56% were concerned about geopolitical stability in Altiant’s Q3 2026 affluent panel. Concern is not a count of canceled trips. Source: Altiant.
- Approximately 32% lower business-jet activity was recorded in WINGX’s Gulf grouping for 2026 through October 4, versus the same period in 2025. This regional flight measure does not isolate leisure demand or establish a single cause for the decline. Source: WINGX.
Luxury travel statistics FAQ
These answers summarize the report’s findings on market size, destinations, spending, wellness, and AI. Each links back to the relevant figures and definitions.
How big is the luxury travel market in 2026?
Grand View Research estimates $1.7 trillion in 2026. Other publishers cover narrower categories, such as luxury hotels or hospitality, so their totals should not be combined. See the market-size table and sources.
Which destinations are most popular for luxury travel?
Italy, Japan, and Greece ranked first, second, and third in Virtuoso’s 2026 advisor outlook. This is an advisor-network ranking, not a ranking of global luxury arrivals or spending. See the destination ranking.
How much does a luxury traveler spend per trip?
There is no single comparable global average. Resonance reported mean spending of $7,900 per trip for its top-10% US cohort and $12,400 for its top-1% cohort. These are survey-specific figures and should not be labeled per-person budgets. See spending definitions and sources.
Is all wellness tourism luxury travel?
No. GWI’s wellness-tourism estimate covers every price level and includes trips where wellbeing is a secondary activity. It is broader than luxury wellness retreats. See the wellness statistics.
Does AI use mean travelers are booking through AI?
No. The figures here measure inspiration, information gathering, and general digital-tool use. They do not establish the share of trips purchased through AI. See the AI findings.
Sources, definitions, and methodology
Last checked: October 12, 2026. Each finding links to its original publisher, research paper, industry report, corporate filing, or an identified copy of an issuer release. A report’s edition year is not necessarily the year measured; dates alongside the figures identify the observation or forecast period.
A wealth-screened survey, a lodging-spend threshold, a five-star hotel category, and an advisor’s client base describe different populations. Use each source’s definition when quoting a finding. A global report can bring together regional evidence without making every survey globally representative.
Key survey populations
| Study | Sample and limits |
|---|---|
| McKinsey, 2024 | 5,061 recent leisure travelers across China, Germany, the UAE, the UK, and the US. The luxury subgroup averaged at least $500 a night in lodging spending; the total survey size is not the luxury subgroup size. |
| Marriott, 2025 and 2026 | Separate affluent Asia-Pacific surveys: 1,750 respondents in seven markets in 2025; 2,800 in eight markets in 2026, including 1,200 Gen Z respondents ages 18–29. Vietnam was added in 2026, so changing market composition limits year-to-year comparisons. |
| Flywire, 2026 report | 520 US adults surveyed in October–November 2025: household income of at least $150,000, average vacation spending of at least $10,000, a recent leisure trip, and prior use of a travel advisor. |
| Resonance, 2026 report | US respondents screened by income or net worth: 1,050 in the top-10% cohort and 451 in the top-1% cohort, surveyed in 2025. Do not add the cohort sizes or interpret the results as a worldwide average. |
| Altiant GLAM, Q3 2026 | 471 affluent/high-net-worth panelists interviewed July–September: Europe 166, North America 164, Asia-Pacific 141. Current-quarter findings are distinguished from the website’s cumulative tracker bases. |
| Virtuoso, 2026 outlook | 2,485 advisor responses across more than 50 countries. Findings describe an advisor network’s outlook and observations, rather than a survey of all travelers. |
| ILTM / Altiant / Hyatt, 2025 | 450 affluent respondents: China 150, Japan 100, Singapore 100, Hong Kong 100. Wellness-option percentages use the interested subgroup of 389. Fieldwork occurred in October 2024 and March 2025. |
How to read comparisons and calculations
- Estimates and forecasts: market models and delivery projections are labeled as such. Corporate results describe the named company, not the whole industry.
- Units: per-trip spending, annual spending, room-night rates, passenger-days, revenue, and assets measure different things. Original currencies are retained; no currency conversions are implied.
- Percentages: multiple-choice responses can overlap. A percentage-point change in occupancy is different from a percentage growth rate. Conditional percentages retain their subgroup denominator.
- Calculations: Calanova calculations are labeled. Greece’s five-star room share divides five-star rooms by all classified hotel rooms; yacht-project growth compares the two dated orderbook counts.
- Wellness totals: GWI’s report contains inconsistent total-trip figures in different places. This article uses the published spending series and labeled shares, without deriving a new total from those conflicting figures.
- Counting: a finding repeated in the opening snapshot or FAQ counts once. Years, sample sizes, study-coverage counts, category thresholds, and qualitative observations do not add to the headline statistic count.
How we select and check sources
We prioritize original research, official statistical releases, company filings, and the issuer’s own survey or operating results. A company release distributed through a newswire remains a company statement. Related documents from one study are treated as one evidence base, not independent confirmations. Commercial forecasts retain their publisher’s scope and are not treated as observed results.
The evidence register checks the value, unit, period, geography, population, and source locator behind each finding. Unresolved luxury-only rail percentages and conflicting wellness trip totals are not used to manufacture market shares. Qualitative observations remain labeled as qualitative.
Calculations and update policy
Delta revenue is converted from source USD millions to USD billions by dividing by 1,000. Greece’s five-star room share uses classified hotel rooms as its denominator. Large-yacht project growth uses (67 ÷ 61 − 1) × 100, rounded to one decimal. Publisher growth figures retain their stated rounding; a CAGR is not recalculated from rounded endpoints.
When a source revises historical data, we check the revised series before comparing years. The review date changes after a substantive evidence check, not merely a formatting edit. Source links identify the publication; the measurement date beside each finding identifies the period the number describes.
Evidence limits and excluded figures
The evidence retained for this article does not establish the following on a consistent worldwide basis:
- Luxury travel’s share of all tourism.
- The demographic distribution of luxury travelers by gender and accessibility needs.
- An average luxury-villa rate using comparable property sizes and inclusions.
- A consistent premium-air total covering both domestic and international travel under one cabin definition.
- The leisure-versus-business split of global premium airline travel.
- An average private-flight cost with consistent routes and aircraft.
- A comparable average luxury-rail fare.
- A ranking of origin markets by consistently defined luxury-travel spending.
- The share of luxury bookings completed through AI.
- A quantified global trade-off between privacy and personalization.
- A fair, consistent carbon comparison across luxury transport and accommodation modes.
- Worldwide conservation or community outcomes attributable to luxury tourism.
IATA’s international business- and first-class count is now included with its scope. It does not cover premium economy or establish unique leisure travelers. The ambiguous Mastercard rail-share percentage and a generic rail emissions comparison are not applied to luxury trains. GWI’s conflicting absolute wellness-trip totals are withheld; its separately labeled spending and composition measures remain.
A survey preference is not independently observed behavior. A sponsor’s research can still be useful, provided the sponsor and sample are visible. An operator’s booking records do not become an industry census because the company operates internationally. The absence of a retained global figure is an evidence limit, not proof that the activity is unimportant.
Glossary
- ADR
- Average daily rate: hotel room revenue per sold room night.
- Occupancy
- Capacity used, expressed as a percentage. Hotel occupancy usually concerns room nights; Viking’s cruise measure uses passenger cruise days and capacity days.
- RevPAR
- Revenue per available room, including available rooms that were not sold in the denominator. All-inclusive package measures have a different revenue scope.
- CAGR
- Compound annual growth rate: the constant annual rate that would connect the starting and ending values over the stated period.
- Percentage points
- The arithmetic difference between two percentages, distinct from their relative percentage change.
- HNWI and UHNWI
- High-net-worth and ultra-high-net-worth individual. Capgemini uses at least $1 million and at least $30 million in investable assets, with specified exclusions. Other studies may use different wealth screens.
- Passenger cruise day
- A passenger-day unit used in cruise operating measures. It is not the same as a unique passenger or an occupied cabin.
- Net Yield
- In the Viking data used here, adjusted gross margin per passenger cruise day. It is not the ticket fare.
- Charter day
- A day of charter activity as reported by the named operator. It is not a unique client or a yacht sale.
- Pipeline
- Planned development or supply that is not yet part of the operating system.
- Primary and secondary wellness travel
- Primary wellness is the main purpose of the trip. Secondary wellness is pursued during a trip whose main purpose is something else.
- Mean and median
- The mean is the arithmetic average. The median is the middle observation in an ordered distribution.
Complete source directory
Sources are grouped by subject below. Publication years and report titles can differ from the observation periods shown in the article. Multiple documents from the same study are listed for traceability.
Markets and traveler research
-
Altiant. GLAM Monitor Q3 2026.
471 interviews, July–September 2026: Europe 166, North America 164, Asia-Pacific 141. Panel results, not a population-weighted global estimate.
-
Bain & Company / Altagamma. Finding a New Longevity for Luxury.
Analyst market estimates; current exchange rates.
-
Capgemini Research Institute. World Wealth Report 2026 press release.
Capgemini wealth sizing; report release pp.1-3 distinguishes wealth model from HNWI survey.
-
Flywire. Luxury travelers prioritize exclusivity over extravagance.
Online survey by Regina Corso Consulting; n=520.
-
Grand View Research. Luxury Travel Market Size, Share & Growth Report.
Commercial model; public summary only.
-
Hurun Research Institute. Chinese Luxury Consumer Survey 2026.
Proprietary survey; mean family assets CNY61m
-
Marriott International. Beyond the Gen Z Myth and the State of Luxury Travel in APEC.
n=2,800, 350 per market; Gen Z n=1,200 aged 18 to 29; fieldwork April 24 to May 19, 2026. Source screens wealthiest 10%. Equal market sample is not population weighting.
-
Marriott International. The Purpose-Driven Traveler.
n=1,750; 250/market; Mar 14 to Apr 17, 2025.
-
McKinsey & Company. Updating perceptions about today’s luxury traveler.
5,061 respondents; Feb 27 to Mar 11, 2024; recent leisure travelers.
-
Mordor Intelligence. Luxury Hotel Market.
Commercial market model; public summary.
-
Preferred Hotels & Resorts / The Harris Poll. The Luxury Travel Report 2025.
More than 500 affluent travelers; Feb to Mar 2025.
-
Resonance / Leger. What do the wealthiest U.S. travelers want from you?.
n=1,050 top-10% and n=451 top-1% reported; income or wealth screening. Cohort overlap/weighting not clarified publicly.
-
Virtuoso. 2026 Luxe Report.
Advisor survey; fieldwork dates and weighting not disclosed. Climate percentages use the conditional base stated in the article.
-
Virtuoso. 2026 Luxe Report trade release.
Network advisor survey
Destinations and seasonality
-
Enchanting Travels. State of Experiential Luxury Travel.
Operator trip records summarized in issuer release
-
Hellenic Chamber of Hotels. Greek hotel capacity, 2025.
Classified hotels and rooms by star category.
-
Istat. Tourism in Italy: 2024 results.
Accommodation nights by residents’ origin and hotel category.
-
JNTO. High-value inbound travel estimates, released June 2025.
Japan, 2023 estimates and comparison with 2019.
Hotels, villas, and clubs
-
Hyatt Hotels Corporation. Q2 2026 earnings release, Exhibit 99.1.
Unaudited company tables A-3. Composite includes Alila, Andaz, Destination, Grand Hyatt, Miraval, Park Hyatt, Unbound and Thompson.
-
IHG Hotels & Resorts. Half-year results for the six months to 30 June 2026.
Company system and pipeline room counts.
-
Inspirato. Q2 2025 operating results.
Issuer operating results
-
onefinestay / Hospitality Net. onefinestay repositions portfolio toward high-end leisure demand.
April 2026 issuer release; Exclusive Collective scale.
Aviation
-
Delta Air Lines. December Quarter and Full Year 2025 Financial Results.
Company passenger-revenue table; USD millions.
-
Delta Air Lines. September Quarter 2026 Financial Results.
Unaudited company passenger-revenue table.
-
Emirates. Winter bookings and product expansion.
Issuer operating update
-
GAMA. 2025 Year-End Aircraft Shipment Report.
Manufacturer-reported shipments; report footnotes apply.
-
GAMA. Second Quarter 2026 Aircraft Shipment and Billing Report.
Manufacturer shipment comparison; original issuer release.
-
Honeywell. 2025 Global Business Aviation Outlook.
Operator survey, OEM plans, macro models, Cirium/WINGX data
-
IATA. 2025 World Air Transport Statistics, released July 2026.
International business- and first-class passenger traffic.
-
United Airlines. Q2 2026 results.
Quarterly issuer results
-
WINGX / JETNET. US demand lifts global business jet activity 2.6% in Week 40.
Tracked flight departures; WINGX flight data with JETNET fleet records; late data revised.
Cruises, yachts, and rail
-
Accor / Orient Express. The grand premiere of La Dolce Vita Orient Express.
Operator-announced cabin configuration.
-
Belmond. The Britannic Explorer makes history as it takes to the rails.
Operator-announced cabin configuration.
-
BOAT International. 2026 Global Order Book.
Projects under construction/on order; speculative builds subject to progress rules.
-
Burgess. Yacht charter demand trends.
Company operational summary
-
CLIA. 2025 State of the Cruise Industry.
Fleet profile and orderbook; historical analysis also credits Cruise Industry News.
-
CLIA. 2026 State of the Cruise Industry.
Industry passenger reporting and forecasts; distinct survey modules.
-
CLIA. The Luxury of Cruising.
CLIA fleet/orderbook and forecast summary linked to 2026 State report.
-
IYC. First-half 2026 charter market and IYC performance.
Broker market estimates and own booking records
-
Mastercard Economics Institute. Travel Report 2026.
Transaction analysis and economic models
-
Viking. Q2 2026 results and booking update.
Issuer SEC financial and operational tables
Wellness and environmental impact
-
Altiant. Focus on Sustainability 2023.
Affluent panel survey
-
Global Wellness Institute. Global Wellness Economy Monitor 2025.
Modeled expenditure estimates; historical series revised.
-
Gössling et al. / Communications Earth & Environment. Private aviation is making a growing contribution to climate change.
ADS-B flight records and fuel/emissions modeling.
-
ILTM / Altiant / Hyatt. Buzz vs Reality APAC wellness report.
Online panel; highest local income/wealth tiers; mixed fieldwork dates
Image credits
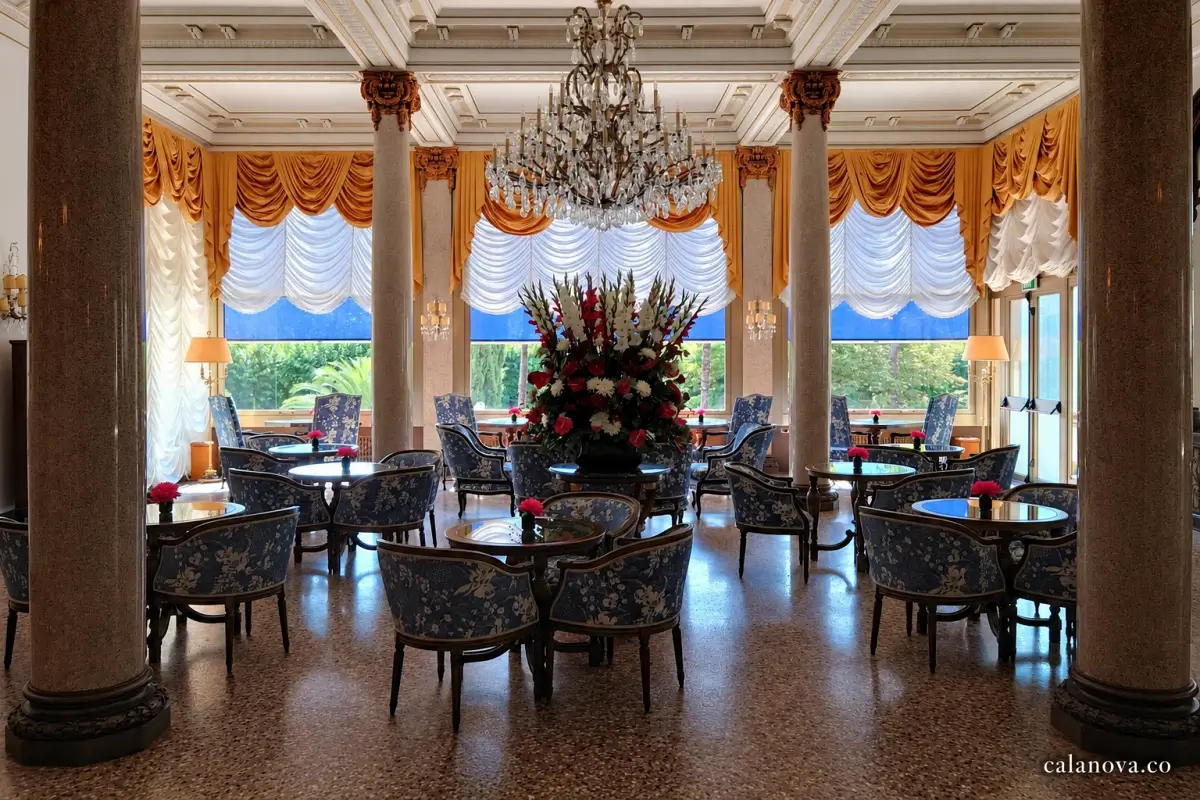
- Grand Lobby and Cocktail Bar Belle Époque at Hotel Splendide Royal Lugano. © by Rafi Thissen / Unsplash. Original photograph.
- A quiet indoor pool setting. © by Nereid Ndreu / Unsplash. Original photograph.
- The dining ritual of luxury rail at Renfe’s Costa Verde Express in Spain. © by Hayffield L / Unsplash. Original photograph.
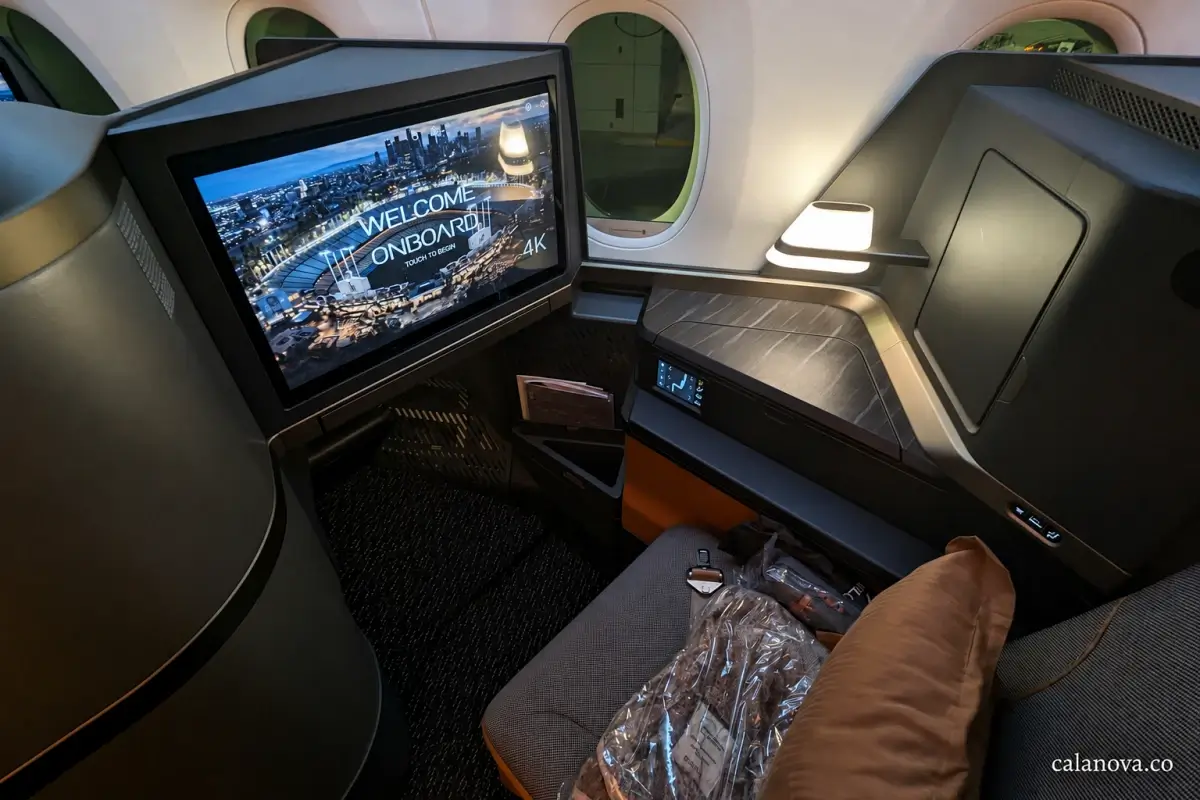
- An individual premium aircraft seat. © by Frugal Flyer / Unsplash. Original photograph.
- Space and privacy in a beachfront villa pool at The Anam in Cam Ranh. © by The Anam / Unsplash. Original photograph.
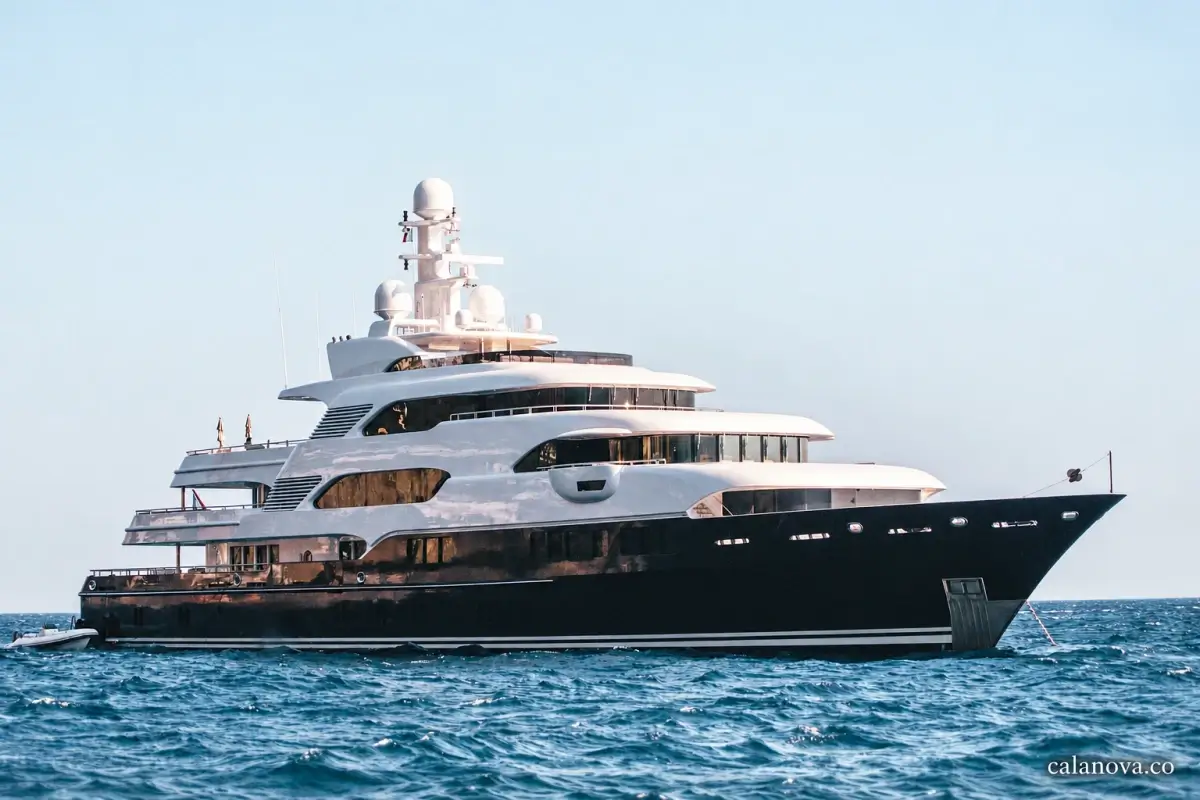
- A yacht at anchor. © by Viktor Ritsvall / Unsplash. Original photograph.